For decades, as the American economy tilted toward white-collar work, big urban counties thrived. Cities like New York, Boston, Chicago, and San Francisco boomed on the back of fast-growing service industries, especially those employing the college-educated. Office towers filled and populations surged. In New York City, crime fell, Wall Street roared, and business services expanded. The result: between 1990 and 2020, Gotham’s population jumped from 7.3 million to 8.8 million, while private-sector employment climbed from 3 million to 4 million.
After 2020, however, freed by remote work, many workers and their families left big cities for smaller, often less dense, areas. Initially seen as a temporary shift, the move has proved more lasting. Census data suggest that what began as a response to the Covid pandemic has become a durable economic and cultural trend, reshaping where Americans live and work. Reversing a pattern dating to the late 1970s, much of the country’s recent population and economic growth is now concentrated in smaller metros. Many who fled cities to escape lockdowns have stayed in their new locations, attracted by lower crime, more affordable housing, and a better quality of life. Businesses are following the talent—often younger workers in their prime. States once plagued by brain drain are now luring educated professionals from elsewhere.
Finally, a reason to check your email.
Sign up for our free newsletter today.
Meantime, efforts to revive America’s industrial base are boosting blue-collar employment in rural and exurban areas, especially in the so-called battery belt, a southern swath where auto-parts manufacturers have clustered. Firms competing with foreign rivals get drawn to these regions, often in Republican-led states, by lower costs, lighter regulation, and more flexible labor laws. Combined with the rise of remote work, this reindustrialization—which the Trump administration seeks to accelerate—is reshaping the geography of American work, giving rise to new economic and political power centers.
The patterns of the last several years run counter to trends that took hold four decades ago. Beginning in the late 1970s, America’s industrial base began to shrink under pressure from foreign competition, rising domestic costs, higher taxes, and increased regulation. Manufacturing jobs had fallen from a peak of 19.4 million to 17.3 million by 2000 and, after the so-called China shock following China’s entry into the World Trade Organization, to 12.6 million by 2019. The losses hit major cities like Chicago and New York as well as industrial hubs like Youngstown and Buffalo.
As this pattern unfolded, the United States rapidly moved toward service-based employment, which helped propel national economic growth, even as manufacturing regions struggled. Service-industry jobs had rocketed from about 65 million in the late 1970s to 107 million by 2000, and 130 million by 2019. Many of these roles were in high-paying fields such as law, accounting, finance, and emerging computer services. Cities that enticed these college-educated workers reaped the benefits, offsetting losses in industrial employment.
New York City, once heavily reliant on manufacturing, has lost roughly 1 million manufacturing jobs since the early 1960s. Yet overall employment has soared, thanks largely to a gain of more than 1.5 million service jobs, including about 400,000 in professional and business services. The greater Chicago area followed a similar pattern: while it shed hundreds of thousands of manufacturing jobs over 35 years, it added nearly 300,000 professional and business services positions, a 60 percent increase.
At the same time, this rapid economic transformation left many smaller regions behind. Buffalo, once a thriving center of metals production and a key transportation hub, began losing its industrial base in the mid-1950s, shedding roughly 100,000 manufacturing jobs. Lacking the global appeal of cities like New York to draw white-collar employment, Buffalo entered a precipitous decline, losing more than 300,000 residents—more than half its peak population—as poverty rates climbed. Many smaller metro areas across the former industrial heartland followed a similarly grim trajectory.
Though these trends persisted through much of the 2010s, pandemic lockdowns disrupted them. Remote work jumped from just 5 percent of workers pre-pandemic to as high as 60 percent during the early months of Covid, and it remained elevated—above 40 percent nationally—for two years. By 2023, even as lockdown restrictions eased and Covid infection rates declined, office occupancy in large metro areas like New York, Los Angeles, Washington, Philadelphia, and Seattle remained below 50 percent, according to data from workplace security firm Kastle Systems, as many workers resisted returning to the office.
Remote workers weren’t just staying home; they were relocating in unprecedented numbers. Many fled not only big-city living but also the rising social disorder following the Black Lives Matter riots in the summer of 2020, along with extended school closures in major urban districts. In states dominated by the three largest U.S. cities—California, New York, and Illinois—children spent far more time in remote learning than elsewhere. These disruptions helped trigger a dramatic shift in migration patterns.
In 2021, America’s largest metro areas—those with more than 1 million residents—lost a net 900,000 people to out-migration, according to census data. Every other category of metro area gained at their expense. The biggest winners were the smallest regions: places with fewer than 30,000 residents went from a net loss of 25,000 in 2019 to a net gain of more than 125,000 in 2021. Regions with 30,000 to 70,000 people added more than 200,000, up from just 45,000 in 2019. The trend continued in 2022, with large metros losing nearly 900,000 more residents, while small regions added another 218,000.
More recent data show that this trend continued through 2024 and included prime-age workers and their families. Some of the nation’s smallest metro areas—those with under 250,000 residents, including many classified as rural—have reversed years of population loss among workers aged 25 to 49, gaining at least 100,000 net new residents in each of the past three years, according to census data.
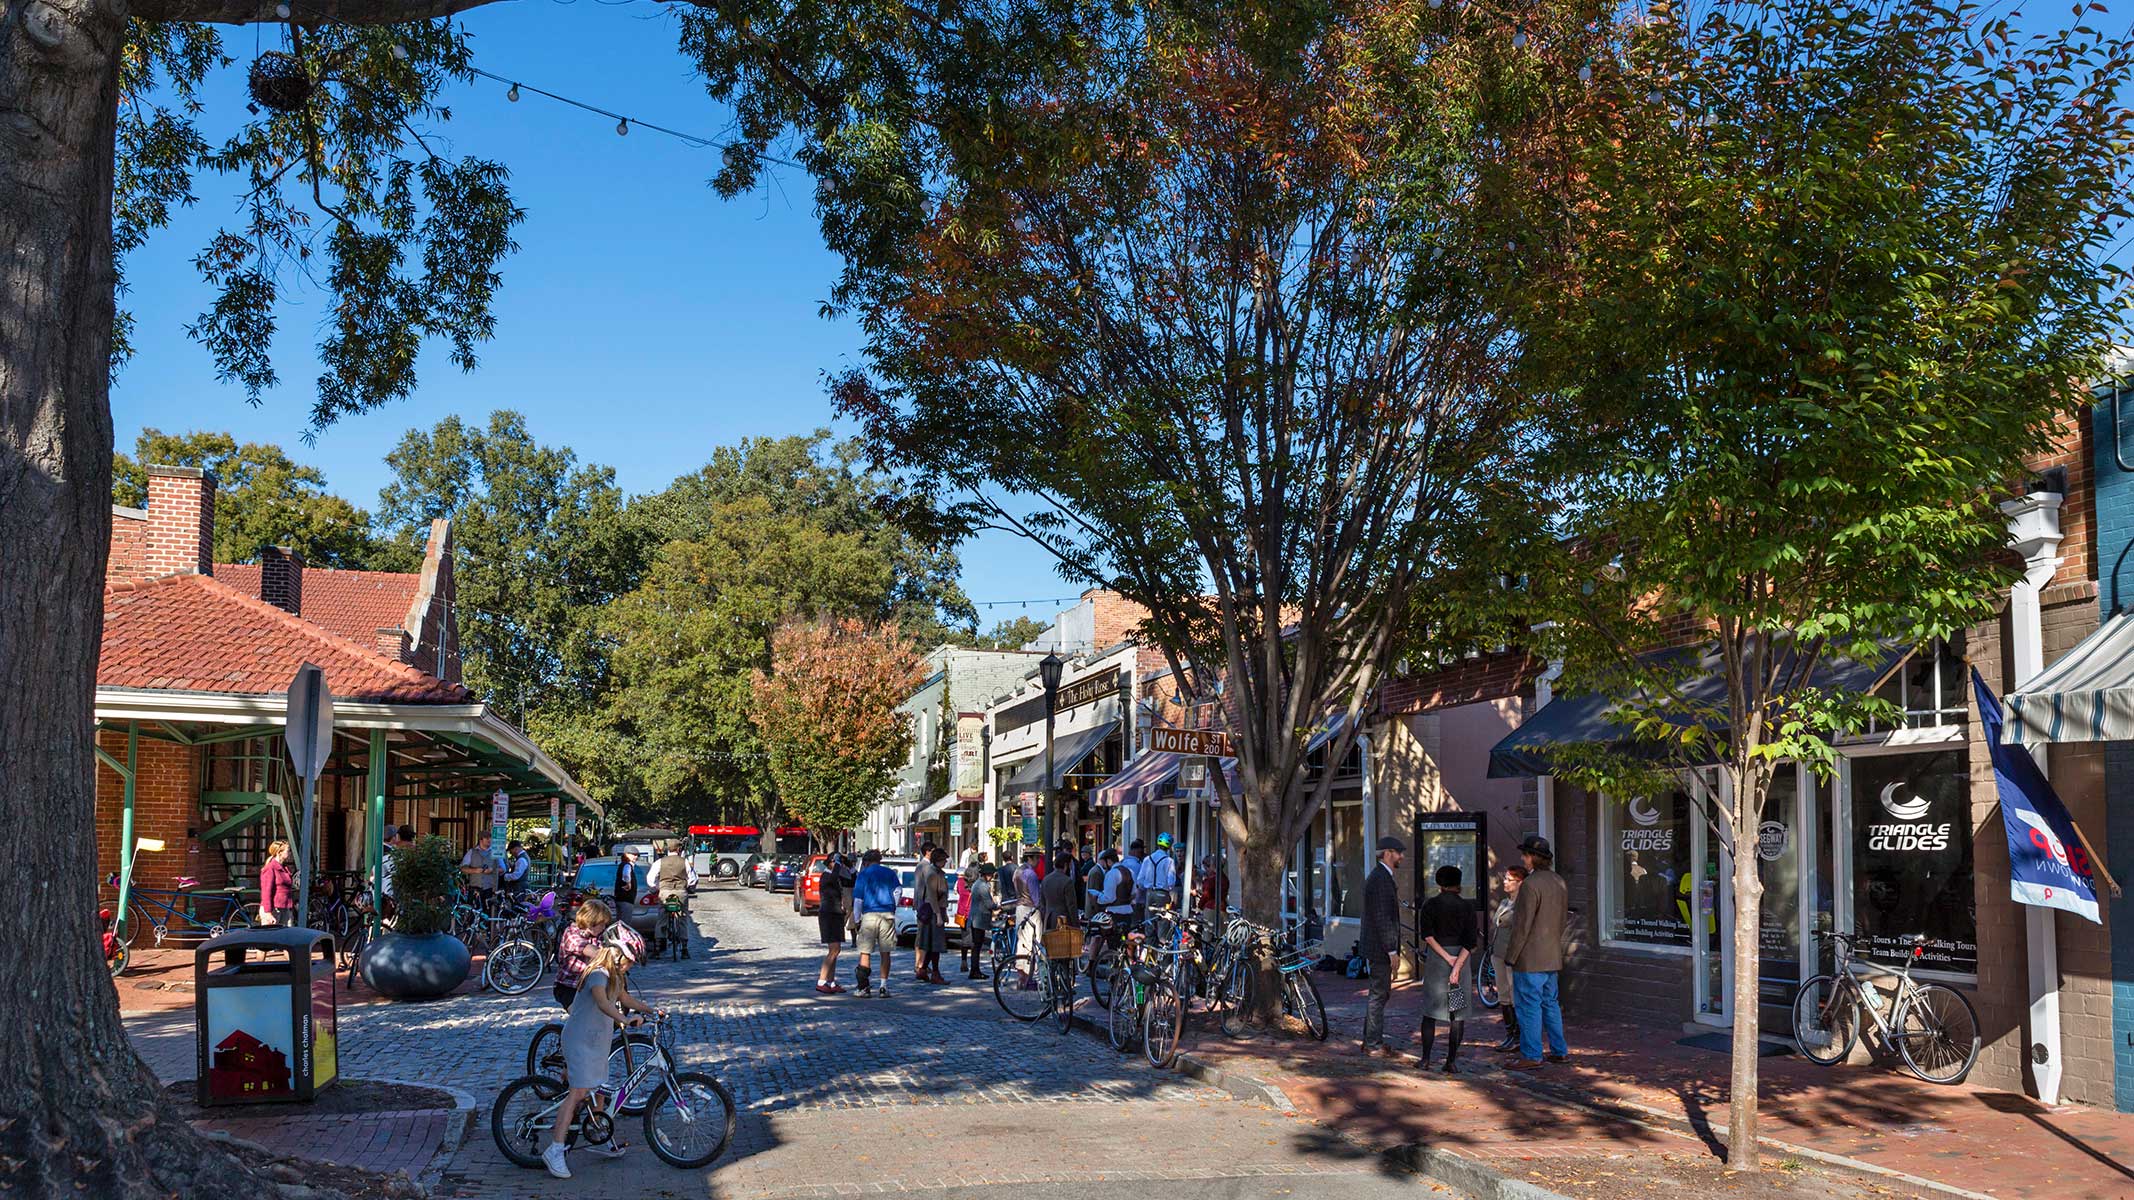
Metro areas with 250,000 to 1 million residents have also grown, thanks in part to the success of midsize cities in some low-cost states, like Raleigh, North Carolina, and Ogden, Utah. These places combine the benefits of lower-density living—less congestion and more affordable housing—with many amenities of larger cities. Collectively, they’ve attracted more than 200,000 working-age migrants annually over the past three years.
This pattern has led some demographers to conclude that a major change in American migration is under way, particularly among workers. One factor driving the development is that even as the country grows more culturally divided, products, media, and services once found only in major markets are now widely accessible. As a recent University of Virginia report observed, “This convergence helped create the conditions that made millions of Americans more willing, in recent years, to move to small cities, towns, and rural counties across the country.”
A map of recent migration patterns reveals the striking shifts, according to research by the University of Virginia’s Cooper Center for Public Service. Much of the Northeast—once the nation’s economic engine—is now marked by regions losing prime-age workers or seeing only modest growth, with the notable exception of New Hampshire and Maine, which show strong gains. In the eastern U.S., one of the biggest surges in working-age adults runs across a broad part of the South, stretching from much of Tennessee into western North and South Carolina and down into northwest Georgia. This region has attracted major investments in car and battery manufacturing, particularly from South Korean firms, which led all countries in U.S. investment in 2023. Florida stands out, too, showing robust growth in working-age adults across nearly all its counties. Texas is a close second, bringing in workers at record rates across a broad region anchored by a triangle formed by Dallas, Houston, and San Antonio.
Some of the most striking reversals have occurred in Illinois and California. While parts of the Midwest—such as Indiana and Ohio—have enjoyed some success in enticing new workers, nearly half of all counties in Illinois, including much of the state’s southern region, are rapidly losing working-age residents. In recent years, firms in neighboring states like Wisconsin and Indiana, reacting to polls showing that many Illinois residents were considering leaving, have launched campaigns to lure workers from the Land of Lincoln, an effort that appears to be working. Similarly, coastal California counties, including those home to San Francisco and Los Angeles, have recorded some of the steepest declines in working-age adults since the pandemic began. Few counties in California are growing, and those that are tend to be found in the state’s eastern regions, far from its urban cores. By contrast, large parts of Montana, Idaho, Utah, and areas of Arizona near the California border are logging unprecedented gains in working-age adults from domestic migration.
“Florida stands out, showing robust growth in working-age adults. Texas is a close second, bringing in workers at record rates across a broad region.”
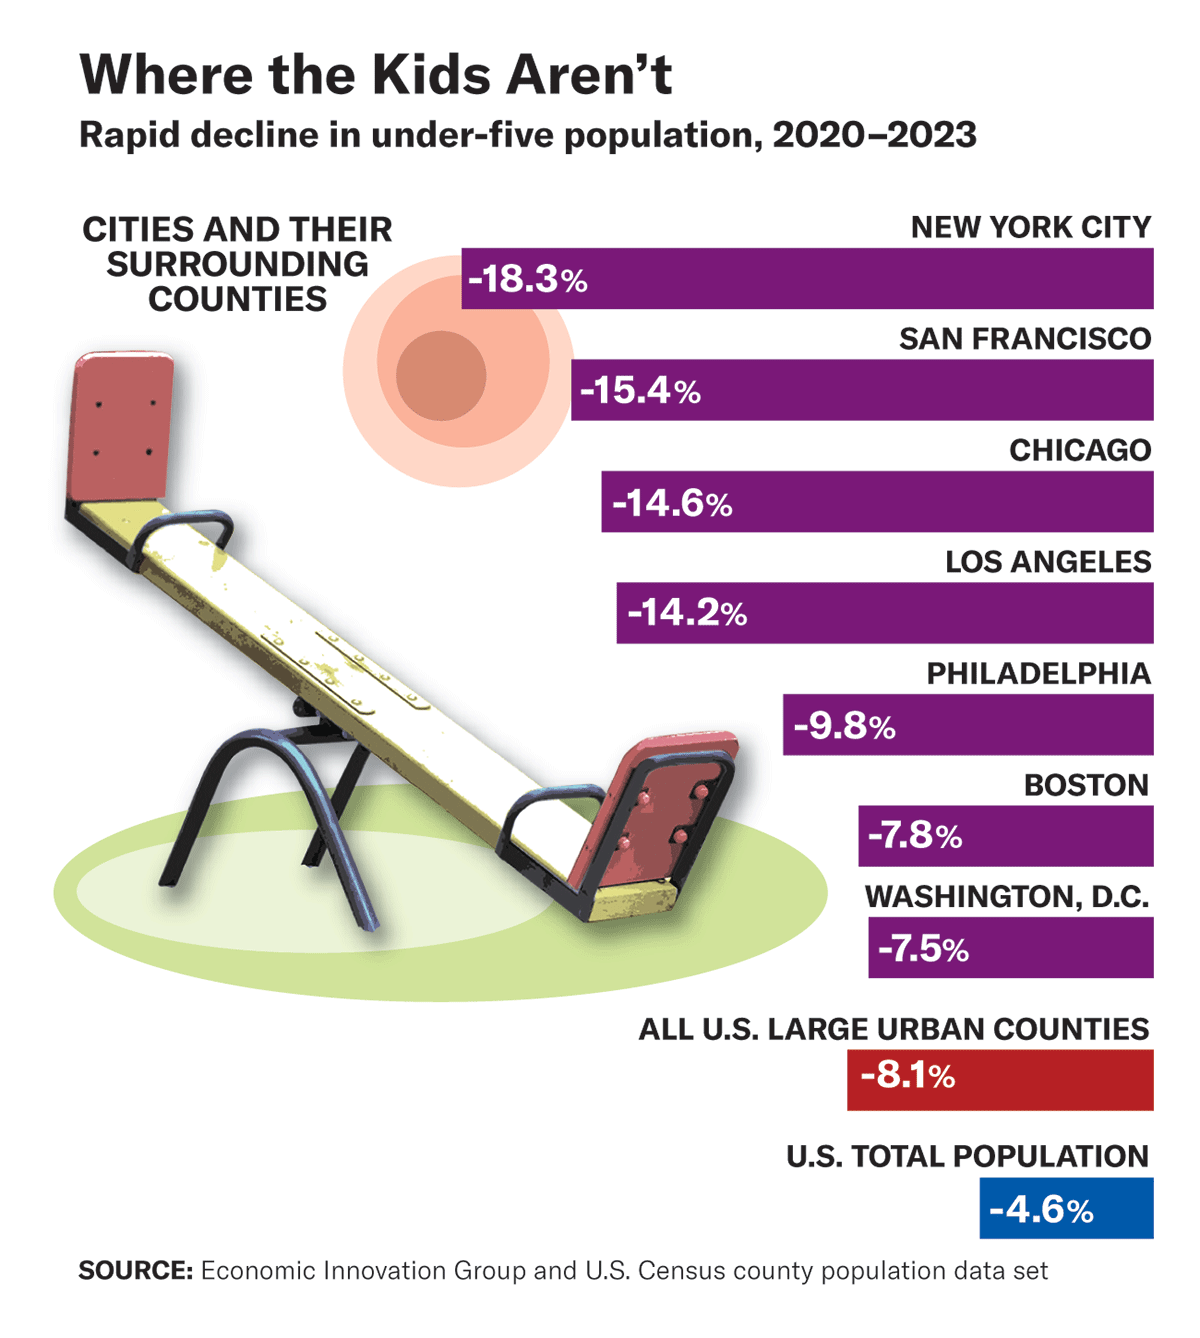
Many of these migrating workers have families with children. A map showing changes in the population of children under five by county since 2020 resembles the new geography of the American worker. Big cities have experienced significant declines in their populations of young children. New York’s number of children under five has fallen 18 percent; San Francisco’s, 15 percent; and Los Angeles’s and Chicago’s, more than 14 percent. The drop supports the view that many domestic migrants are fleeing large urban school districts, which kept students in remote learning far longer than others during the pandemic—contributing to troubling drops in academic performance. Some of the largest school districts have since suffered major enrollment falloffs, setting off budget crises. Though the family-migration rate has recently slowed somewhat from the pandemic years, urban counties are still a long way from recapturing those lost workers and their children.
Meantime, exurban areas—districts beyond the suburbs, characterized by rural living—have made the greatest proportional gains in their population of young kids. One study by the Economic Innovation Group identified more than 80 exurban counties across the South alone where the population of young children is growing.
Many of these boomtowns are little known—except to job seekers. Among the counties with the highest percentage gains in net migration of working-age adults since the start of the pandemic are Comal County, Texas; Dawson County, Georgia; and Broadwater County, Montana. Some were growing before 2020, but the pandemic supercharged their appeal.
In Comal County, centered about 35 miles northeast of San Antonio, the working-age population has expanded 27 percent since the pandemic began. Comal has added about 20,000 new jobs so far this decade, a nearly 30 percent increase. The median household income is an impressive $99,000, supported by a well-educated population: about 35 percent of adults hold at least a bachelor’s degree. The poverty rate is just 7 percent, well below the national average, and the violent-crime rate is 38 percent lower. The median home value stands at $398,000. According to market research by Lightcast, the top hiring sectors include health care, sales, office administration, and management.
Once known as “the birthplace of stock car racing,” Dawson sits some 50 miles north of Atlanta, on the cusp of the Blue Ridge Mountains. County officials boast that it offers newcomers “the quality of life you are looking for with wide open spaces, recreation, entertainment, sporting events and educational opportunities for the entire family.” It’s a pitch that apparently works. Though small by population, with about 34,000 residents, Dawson County has grown by more than a quarter since 2020. About 36 percent of residents hold at least a bachelor’s degree, and the median household income is nearly $90,000. While rising, the average home value remains relatively affordable, at $351,000. The local economy is anchored in professional, scientific, and technical services, with major employers in health care, retail, and construction.
Gains of this magnitude in small regions like Dawson might seem easy to dismiss as anomalies or too modest to influence the broader U.S. economy. But what’s significant is the breadth and consistency of the trend. As recently as the last decade, only 27 percent of areas classified as rural or small metro regions boasted an increase in their prime working-age populations. In the 2020s, however, more than 60 percent of these areas are growing, suggesting a significant shift in attitude among large segments of the American workforce.
Demographers studying recent migration trends point to a mix of cultural and economic factors—most notably, lower crime, better schools, and a growing preference for natural surroundings, a shift accelerated by the pandemic. Analysts at the University of Virginia’s Cooper Center for Public Service observe that growth in the working-age population closely follows the U.S. Department of Agriculture’s natural amenities scale, which evaluates climate, topography, and water access—key features associated with quality of life. They argue that the regions boasting the largest post-pandemic gains in jobs, income, and working-age adults reflect these preferences. In areas with the highest amenity scores, the average income of new arrivals has jumped by $30,000 since 2019, whereas places with the lowest scores—including many major cities—have logged income gains just one-sixth as large.
Areas with more natural amenities also tend to have less expensive housing than America’s major cities. This matters because the nation’s housing affordability crisis—set in motion by the construction slowdown following the 2008–09 financial crash—has clearly played a role in driving recent migration trends. Research has long shown that high housing costs worsen employers’ difficulties in recruiting workers, while many residents cite those costs when telling pollsters why they want to leave expensive states like California. A recent survey of California voters by ideology found that 39 percent of moderates, 45 percent of conservatives, and 26 percent of liberals were considering leaving the state because of stratospheric housing prices.
A look at the nation’s most expensive housing markets reinforces the point. Major cities like Boston, New York, Seattle, and Los Angeles—now rapidly losing working-age residents—dominate the list. The median cost of a home among the Top 10 priciest metro areas is approximately $850,000. Smaller markets showing the most growth in prime-age workers, including smaller counties in Colorado, Texas, and Georgia, typically have average home values less than half that amount.
Within these larger movements are smaller patterns remaking various regions. A recent report from the Federal Reserve Bank of Kansas City, for instance, notes that Oklahoma, a largely rural state, had long struggled with brain drain, consistently losing more college-educated residents than it gained. In 2019 alone, that net loss amounted to 29,000 college graduates. But in a notable turnaround, since 2020, the state has seen its population of working-age college graduates surge. Among those gains: a net increase of about 4,000 college-educated migrants from California and 2,200 from Oregon over four years. Oklahoma also seems to be benefiting from its proximity to booming Texas, which it borders. Some of the state’s flourishing counties sit adjacent to similarly successful areas in northeast Texas. Analysts also credit remote work as a key factor in Oklahoma’s recent gains. A recent study found that a program offered by Tulsa that pays remote workers $10,000 to relocate to the midsize city has attracted more than 3,000 participants. Officials estimate that those workers have brought with them $622 million in direct employment income. The attention garnered by Tulsa’s initiative has prompted other smaller metro areas, including Bentonville, Arkansas, and Newton, Iowa, to adopt similar plans.
The latest census data add nuance to earlier research on the recovery from pandemic closures. A 2022 Moody’s study found that Republican-led states were already pacing the economic rebound, having regained 341,000 jobs lost since 2020, while Democratic-led states remained short about 1.3 million jobs. Republican states recovered more quickly partly because they reopened their economies and key institutions, such as schools, earlier. And while Democratic states like California, New York, and New Jersey used pandemic slowdowns in tax revenues to justify tax hikes, Republican states cut taxes nearly two dozen times in fiscal 2021 and 2022, seeking to stimulate recovery.
These data underscore how state-level policies on taxes, regulations, and reopenings continue to influence migration. Progressive states like California and New York include large rural areas and smaller metro regions, but few of these are registering the kinds of gains typical in Republican-led states. While several counties in New York’s scenic Hudson Valley have grown, largely thanks to residents fleeing New York City during the worst of the pandemic, key regions in upstate New York—such as rural areas in Greater Niagara and the Finger Lakes—have yet to experience the worker migration that’s powering expansion elsewhere.

The latest migration trends pose a serious challenge for America’s largest urban areas, especially because the politics of many big cities remains resistant to the kinds of policies that might help retain or recover fleeing workers. While some major cities have started to make progress on crime, for example, they face a new wave of disruptive, sometimes violent, anti-deportation protests—complete with torched cars and masked demonstrators—that evoke the dystopian Black Lives Matter riots of 2020.
Cities have offset some domestic out-migration with an influx of foreign immigrants during the Biden years. But many of these newcomers are low-skilled workers who, even if legally able to work, will likely need government subsidies to afford life in major metro areas—and they’re no substitute for the high-skilled workers who are leaving.
In fact, the pandemic years may have driven out the very voters most likely to demand and support reform, further intensifying the leftward shift of urban politics. In Chicago, for instance, voters dissatisfied with Mayor Lori Lightfoot and concerned about rising crime nonetheless elected an even more radical candidate, Brandon Johnson, who promptly dismantled effective crime-reduction programs like the city’s gunshot-detection system. A former official with the city’s teachers’ union, Johnson is also working to roll back efforts to expand school choice in Chicago. In New York, a young and relatively unknown socialist, Zohran Mamdani, has secured the Democratic nomination for mayor with a campaign built on a radical agenda at odds with the reforms that helped revive the city in the 1990s and early 2000s.
This same leftward drift is playing out in blue-state capitals. In Illinois—already struggling with massive out-migration and a reputation among company executives as one of the least business-friendly states—lawmakers passed a budget that raised taxes by about $1 billion, including over $500 million in new corporate taxes. New York State’s latest budget imposes $1.4 billion in additional levies on midsize and large businesses in New York City and surrounding counties, which already bear some of the nation’s highest tax burdens.
For decades, economists have used terms like “agglomeration” and “clustering” to describe the advantages that industries and workers gain by concentrating in large numbers in major metro areas. But the pandemic seems to have weakened that advantage. Remote work has given employees—especially the most skilled—greater control over where they live. A Pew survey discovered that half of all remote workers between the ages of 19 and 49 would quit their jobs if required to return to the office full time.
At the same time, companies are discovering that bringing workers back to the office hasn’t delivered the expected payoff. One recent study found that corporate performance didn’t improve with a return to in-office work. Remote work has also eroded one of the traditional advantages of big-city employment: higher wages. Since the pandemic, the wage premium for working in large metro areas has dropped by 43 percent, making the high cost of living in those cities harder to justify.
It’s not clear that the political leadership of America’s largest cities grasps the new reality—or what it will take to respond. Reversing current trends will require a sharp course correction. Cities must confront rising disorder with proven policing strategies, not ideological experiments. They need to reform zoning and permitting rules that stifle housing supply and drive up costs. Public schools—still reeling from enrollment losses—must open to choice and innovation, not remain captive to union demands. And instead of burdening employers and professionals with ever-higher taxes, city governments should focus on restoring core services and creating conditions that reward work, enterprise, and family life.
Without such reforms, big cities won’t regain their populations of working- and middle-class residents and their families—and will increasingly risk becoming enclaves of dysfunction, left behind by an economy and workforce that have moved on.
Top Photo: Downtown Raleigh, North Carolina, epitomizes the rapid growth of smaller cities since the pandemic. (Ian G Dagnall/Alamy Stock Photo)
Source link