What looked this week like a fresh sign of rising inflation may have sprouted months earlier in the desert around Yuma, Arizona.
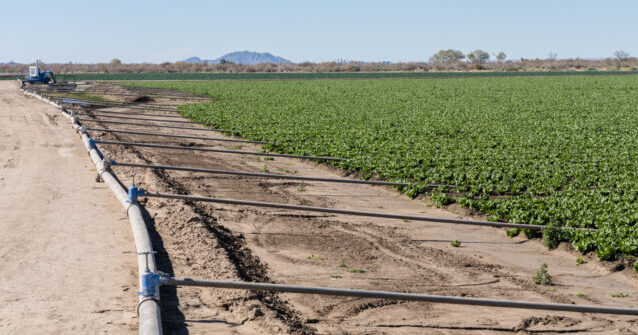
Yuma is America’s winter lettuce capital, supplying roughly 90 percent of the leafy greens eaten in the U.S. and Canada between November and March. Last November, the city recorded 1.44 inches of rain, more than six times its normal 0.23 inch for the month, making it Yuma’s eighth-wettest November on record and its wettest since 2008. On Nov. 21 alone, Yuma set a daily rainfall record with 0.96 of an inch.
That weather shock appears to have helped set off one of the oddest numbers in last week’s inflation data.
The Bureau of Labor Statistics said producer prices for fresh and dry vegetables jumped 48.9 percent in February, a move so large it accounted for more than 20 percent of the increase in final-demand goods. At first glance, it looked like another sign that goods inflation might be heating up again.
That an increase in vegetable prices of that size could have gone unnoticed seemed improbable. Grocery shoppers would have been staggering out of the stores in shock. The television news programs would have raised the alarm about a renewed affordability crisis. But vegetable prices did not really rise by nearly 50 percent in February.
A closer look suggests something narrower and stranger: a lettuce shock.
Produce trade reports began describing the problem weeks earlier. Industry coverage said heavy Thanksgiving-season rains in Arizona and California’s desert growing regions, followed by unusual warmth, created planting and harvesting gaps that tightened supplies of cool-weather lettuce varieties. Markon, a large produce distributor, said in February that erratic growing conditions including rain, heat, and cold had left desert supplies snug and prices elevated.
Government weather data and local reporting point the same way. USDA’s Weekly Weather and Crop Bulletin noted record daily highs of 81 degrees in Yuma on Jan. 14. By late February, local television reports said growers were racing to harvest before temperatures pushed into the 90s, after what they described as an unusually wet fall.
The clearest evidence that lettuce was the main driver comes from USDA market reports. In mid-January, iceberg lettuce in western Arizona was selling mostly around $16.50 to $17.55 a carton. By Feb. 2, that had jumped to mostly $33.45 to $37.55, with USDA describing supplies as “very light.” By Feb. 23, prices had eased but were still elevated, mostly around $25.55 to $27.55.
That pattern helps explain why the producer-price number looked so dramatic. Public BLS series show the producer-price index for lettuce more than doubled from January to February, while the broader index for fresh vegetables except potatoes also surged. By contrast, artichokes, beets, potatoes, cabbage, and corn fell, and dry vegetables barely rose, pointing to lettuce rather than a broad vegetable boom as the likeliest source of the jump. Lettuce is the most heavily weighted crop in the PPI’s vegetable index so when its price moves a lot, the index tends to move significantly. There were also increases in the prices of broccoli, cauliflower, celery, and snap beans in February but those have less weight in the broader index.
Consumer prices showed a much smaller effect. The CPI’s lettuce index rose 12.2 percent in February, while fresh vegetables overall rose 4.1 percent. That means shoppers did see some of the lettuce shock, but nothing close to the explosion visible in the producer data.
The gap reflects the difference between the two indexes. Although the Producer Price Index is often described as a “wholesale price index,” it doesn’t particularly focus on wholesale prices. That’s a hangover from when its official name was the Wholesale Price Index, although it hasn’t been named that since 1978 and even prior to the change it was not an index of wholesale prices. (Somehow this has escaped the attention of news organizations such as Bloomberg and the Associated Press, both of which insist on calling changes in the PPI changes in wholesale prices.)
Instead, the PPI measures changes in the selling prices received by domestic producers for their output. For many products and some services, those prices come from the first commercial transaction. For agricultural products, the prices are typically what farmers receive for their crops, as recorded by the USDA. The Consumer Price Index, by contrast, measures what consumers actually pay at retail. A violent move in a narrow farm category can therefore loom large in producer data while showing up only partially, or briefly, at the checkout line.
The lettuce index is highly volatile month to month, as many food indexes are. The February spike of 121 percent was the fifth time in the past three years that the monthly price index jumped more than 100 percent compared with the prior month. The last time prices more than doubled, in July of last year, the lettuce index fell nearly 27 percent the following month and continued to fall in the month after that.
By March, the episode already appeared to be fading. USDA’s March 18 report showed iceberg lettuce in the desert region back to mostly $14.00 to $15.50 a carton, near mid-January levels. What had looked in February like a broad inflation signal now appears more like a short-lived produce disruption caused by weather whiplash in the winter lettuce belt.
That does not make the February inflation reports meaningless. It does suggest one of their hottest subcomponents was telling a far more specific story than the headline implied. Sometimes inflation data signal a broad economic trend. Sometimes they signal that it rained too much in Yuma, and then got too hot.