
NEWYou can now listen to Fox News articles!
President Donald Trump isn’t on the ballot this year, but New Jersey voters are sending him a message. More are negative toward Trump than positive by 11 percentage points, and more than twice as many say their vote in this year’s gubernatorial race will be to express opposition to the president rather than to show support.
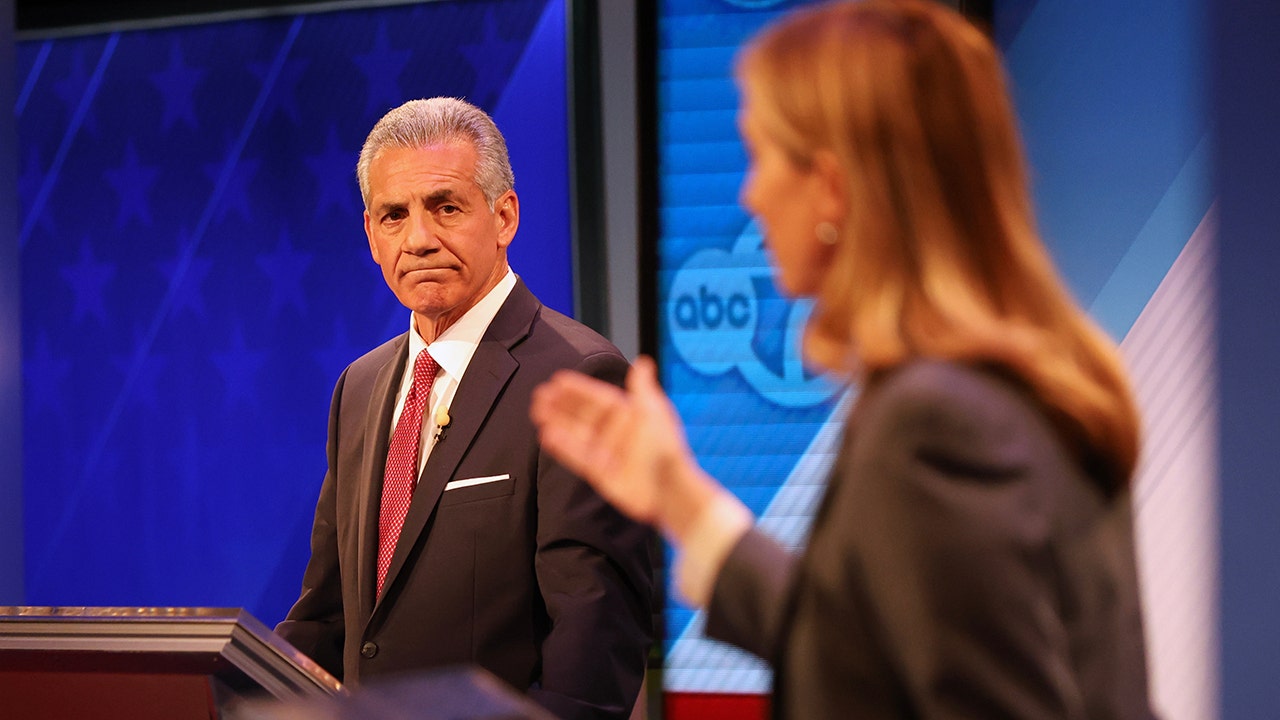
That helps Democrat Mikie Sherrill best Republican Jack Ciattarelli by 52% to 45% heading into the last few days of the campaign, according to a Fox News poll of New Jersey likely voters. Her 7-point lead is just outside the poll’s margin of sampling error. Earlier this month, Sherrill was ahead by 5 points, and in September she was up by 8 points.
“It’s a cliché, but it’s true, this race is all about turnout, so the big question is whether Trump supporters show up when he’s not on the ballot,” says Daron Shaw, a Republican who conducts the Fox News Poll with Democrat Chris Anderson. “Sherrill’s supporters seem like they are going to turn out, but the evidence is mixed for those backing Ciattarelli. If the MAGA base comes around during this final weekend, the Democratic advantage narrows considerably.”
This analysis is among likely voters.
Among those who say they are extremely enthusiastic about voting this year, Ciattarelli is ahead by 5 points – but among those either extremely or very enthusiastic, it’s Sherrill by 4. That’s because more Republicans feel extremely enthusiastic (52%) than Democrats (40%).
Some 93% of Ciattarelli’s backers feel certain they will vote for him compared to 91% for Sherrill, while 8% overall say they could switch their pick before voting. Only 3% say they will vote for someone other than these two major party candidates or are undecided on their choice.
FOX NEWS POLL: DESPITE DIP IN APPROVAL, CONGRESSIONAL REPUBLICANS STILL OUTPERFORM DEMOCRATS
There’s a 17-point gender gap, as Sherrill leads by 16 points among women, while it’s Ciattarelli +1 point among men.
Ciattarelli is favored by 4 points among White voters and by 10 points among men without a college degree. Fully 98% of self-identified MAGA supporters are backing him.
Sherrill is preferred by 48 points among non-whites, 24 points among voters younger than 45, and 16 points among those with a college degree.
Some 97% of Democrats support Sherrill, while Ciattarelli gets 92% among GOPers. Seven percent of Republicans say they are backing Sherrill compared to only 1% of Democrats voicing support for Ciattarelli. (There are too few independents to break out.)
More New Jersians think Sherrill is honest and trustworthy than say the same about Ciattarelli.
He’s in negative territory by 6 points on this measure (47% honest vs. 53% dishonest), while she’s in positive territory by 13 points (56% vs. 43%).
It’s about the same for their favorability ratings. Sherrill has a net positive rating by 9 points (54% favorable vs. 45% unfavorable). Ciattarelli’s rating is underwater by 6 points (46% vs. 52%). Some 28% have a strongly favorable view of each candidate, but by a 9-point margin more have a strongly unfavorable opinion of Ciattarelli than Sherrill.
On handling top issues, voters trust Ciattarelli on crime by 3 points. Sherrill is favored by wider margins to handle the cost of living (+8), taxes (+9), energy costs (+10), and healthcare (+16).
The candidates are vying to fill the seat of term-limited Democratic Gov. Phil Murphy, who won re-election in 2021 by beating Ciattarelli by 3 points.
Voters have mixed feelings about Murphy, as 49% view him favorably and 48% negatively.
For Trump, it’s 44% favorable (31% strongly) vs. 55% unfavorable (48% strongly).
Among voters who have a strongly favorable view of Trump, 63% say they are extremely enthusiastic about voting in the governor’s race, while that number is only 39% among those who have a strongly unfavorable view him.
While 16% of New Jersey voters say one reason for their vote is to show support for Trump, more than twice as many are voting to show opposition (35%). About half say the president is not a factor in their vote.
Two-thirds of Sherrill supporters say their vote is to express opposition to Trump compared to one-third of those backing Ciattarelli, who say theirs is to show support.
“Every four years, New Jersey gets the spotlight as the country looks for indications of which way the political winds are blowing,” says Anderson. “The degree to which the election is a harbinger is debatable, but regardless of the outcome, it’s clear Sherrill will get support from some who are more interested in signaling opposition to Trump than in electing her governor.”
The last time the New Jersey governor’s mansion stayed with the same political party for three consecutive terms was 1961.
CLICK HERE FOR CROSSTABS AND TOPLINE
Conducted October 24-28, 2025 under the joint direction of Beacon Research (D) and Shaw & Company Research (R), this Fox News Poll includes interviews with a sample of 1,107 New Jersey registered voters randomly selected from a statewide voter file. Respondents spoke with live interviewers on landlines (121) and cellphones (728) or completed the survey online by following a link received via text message (258). There was a subsample of 956 likely voters. Results based on both the registered voter and likely voter sample have a margin of sampling error of ± 3 percentage points. Sampling error for results among subgroups is higher. In addition to sampling error, question wording and order can influence results. Sources for developing weight targets include the most recent American Community Survey, Fox News Voter Analysis, and voter file data. Weights are generally applied to age, race, education, and area variables to ensure the demographics of respondents are representative of the registered voter population. Likely voters are identified based on past vote history and self-reported likelihood of voting. Results among subgroups are only shown when the sample size is at least N=100.
Fox News’ Victoria Balara contributed to this report.